Multi Scale Human
Das durch die EU geförderte Marie Curie ITN MultiScaleHuman visualisiert die Funktionalität des menschlichen Körpers unter einem dynamischen 3D Multiskalen-Ansatz. Ziel ist es, ein besseres Verständnis von Gelenkkrankheiten und die Diagnose und die Behandlung von Patienten effizienter zu gestalten.
An einem innovativen Projekt zur 3D-Visualisierung des Muskel-Skelett-Systems arbeitet das Welfenlab. Damit ist die Leibniz Universität Hannover erstmalig als Partnerin an einem „EU – Marie Curie Initial Research Training Network“ beteiligt. Unter anderem werden dadurch Dissertationsprojekte für zwei internationale Doktoranden an der Leibniz Universität finanziert.
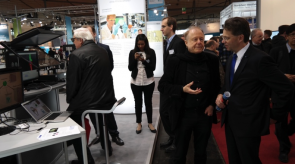
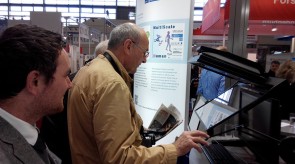
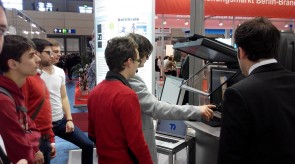
Das interaktive 3D-Simulationsmodell des menschlichen Körpers soll molekulare, zellulare, organische, metabolische und 3D-Bewegungsaufnahmen vereinen. Die Ziele sind eine bessere Vorhersage und patientenangepasstere Behandlung bei Erkrankungen des Muskel-Skelett-Systems. Das Projekt MultiScaleHuman, in dem das Forschungsvorhaben angesiedelt ist, ist ein europäisches Marie-Curie-Training-Netzwerk. Ziel ist es, die Funktionalität des menschlichen Körpers in einer neuen, dynamischen Art und Weise darzustellen. Hinter dem Projekt steht ein europäisches Netzwerk mit Partnern aus vier Ländern, beteiligt ist unter anderem auch die Medizinische Hochschule Hannover (MHH). Die Forschergruppe unter der Leitung von Prof. Franz-Erich Wolter und Dr. Karl-Ingo Friese hat das Projekt im März 2013 und 2015 auf der CeBIT vorgestellt.
Die Visualisierung von Daten aus dem Bereich der Medizin ist ein aktueller Schwerpunkt des Fachgebiets Graphische Datenverarbeitung. Die Daten stammen unter anderem aus bildgebenden Verfahren wie Computertomographie oder Magnetresonanztomographie. Aus Sicht der Informatik stellt sich die Frage, wie solche Daten in einer allgemein verständlichen Art und Weise interaktiv dargestellt werden können. Dieses Projekt wird auch im Rahmen eines Humboldt-Forschungspreises durch die Kooperation mit der Preisträgerin Prof. N. Thalmann (Universität Genf und Singapore) gefördert, die von Prof. Wolter nominiert wurde und an der Organisation des Kongresses Computer Graphics International 2013 beteiligt war, die zum 30 Jubiläum von Prof. Wolter im Juni 2013 in Hannover unter der Schirmherrschaft des niedersächsischen MP organisiert wird.
In enger Verbindung mit der Visualisierung selbst seht die Interaktion mit multiskalaren Daten. Im Zuge dieses Projektes wurden neue multimodale 3D-Interaktionsmethoden mit und ohne haptische Unterstüzung (haptic and touchless) untersucht und mit realen Benutzern getestet und weitereintwickelt. Als Grundlage für die Entwicklung der haptischen Komponente konnte hier auf eine vorangehende, durch DAAD/Siemens geförderte, Arbeit zurückgegriffen werden.
Detaillierte Informationen zum Projekt, das von Prof. N. Thalmann koordiniert wird, finden Sie hier: http://multiscalehuman.miralab.ch/
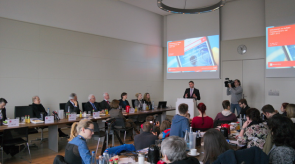
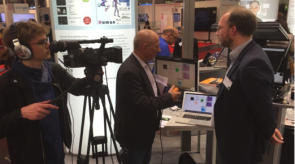
Galerie (CeBIT 2013)
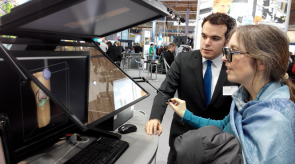
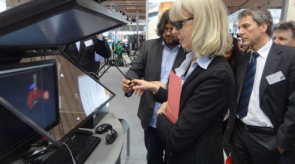
Galerie (CeBIT 2015)
Publikationen
| Artikel |
| 2016 |
Ricardo Manuel Millán Vaquero, Alexander Vais, Sean Dean Lynch, Jan Rzepecki, Karl-Ingo Friese, Christof Hurschler, Franz-Erich Wolter Helical Axis Data Visualization and Analysis of the Knee Joint Articulation (+video) Journal of Biomechanical Engineering 138. Issue 9. DOI: 10.1115/1.4034005 The American Society of Mechanical Engineers 2016 Beschreibungstext anzeigen We present processing methods and visualization techniques for accurately characterizing and interpreting kinematical data of flexion–extension motion of the knee joint based on helical axes. We make use of the Lie group of rigid body motions and particularly its Lie algebra for a natural representation of motion sequences. This allows to analyze and compute the finite helical axis (FHA) and instantaneous helical axis (IHA) in a unified way without redundant degrees of freedom or singularities. A polynomial fitting based on Legendre polynomials within the Lie algebra is applied to provide a smooth description of a given discrete knee motion sequence which is essential for obtaining stable instantaneous helical axes for further analysis. Moreover, this allows for an efficient overall similarity comparison across several motion sequences in order to differentiate among several cases. Our approach combines a specifically designed patient-specific three-dimensional visualization basing on the processed helical axes information and incorporating computed tomography (CT) scans for an intuitive interpretation of the axes and their geometrical relation with respect to the knee joint anatomy. In addition, in the context of the study of diseases affecting the musculoskeletal articulation, we propose to integrate the above tools into a multiscale framework for exploring related data sets distributed across multiple spatial scales. We demonstrate the utility of our methods, exemplarily processing a collection of motion sequences acquired from experimental data involving several surgery techniques. Our approach enables an accurate analysis, visualization and comparison of knee joint articulation, contributing to the evaluation and diagnosis in medical applications. |
| 2015 |
Ricardo Manuel Millan Vaquero, Sean Dean Lynch, Benjamin Fleischer, Jan Rzepecki, Karl-Ingo Friese, Christof Hurschler, Franz-Erich Wolter Enhanced Visualization of the Knee Joint Functional Articulation Based on Helical Axis Method Bildverarbeitung für die Medizin 2015, Informatik aktuell 2015 449-454 Springer Berlin Heidelberg 2015 Beschreibungstext anzeigen Comprehensive descriptions of the motion in articulating joints open new opportunities in biomedical engineering. The helical axis is a established method that describes flexion-extension at joints, which currently lacks an intuitive visualization. In this paper, we present a comprehensive visualization of knee joint motion based on a direct measurement of the helical axis. The proposed approach incorporates the three-dimensional motion of patient-specific bone segments and the representation of helical axes on the bone, facilitating the observation of the flexion-extension motion at the knee joint. |
Ricardo Manuel Millan Vaquero, Alexander Vais, Sean Dean Lynch, Jan Rzepecki, Karl-Ingo Friese, Christof Hurschler, Franz-Erich Wolter Helical axis data visualization and analysis of the knee joint articulation (presentation) Accepted as a lecture presentation in 29th International Congress and Exhibition of Computer Assisted Radiology and Surgery (CARS). 2015 Beschreibungstext anzeigen Accepted as a lecture presentation in 29th International Congress and Exhibition of Computer Assisted Radiology and Surgery (CARS 2015). |
Ricardo Manuel Millán Vaquero, Asan Agibetov, Jan Rzepecki, Marta Ondrésik, Alexander Vais, Joaquim Miguel Oliveira, Giuseppe Patanè, Karl-Ingo Friese, Rui Luís Reis, Michela Spagnuolo, Franz-Erich Wolter A semantically adaptable integrated visualization and natural exploration of multi-scale biomedical data 12th International Conference BioMedical Visualization (MediVis) 2015 19th International Conference on Information Visualisation. IEEE 2015 Beschreibungstext anzeigen The exploration of biomedical data which involves heterogeneous sources coming from different spatial scales and medical domains is a challenging topic in current research. In this work, we combine efforts regarding multi-scale visualiza-tion, multimodal interaction and knowledge formalization for the exploration of multi-scale biomedical data. The knowledge formalization stores and organizes the information sources, the integrated visualization captures all relevant information for the domain expertise of the user and the multimodal interaction provides a natural exploration. We present a concrete example of use of the proposed exploratory system designed for a biologist investigating multi-scale pathologies. |
| 2014 |
Asan Agibetov, Ricardo Manuel Millán Vaquero, Karl-Ingo Friese, Giuseppe Patanè, Michela Spagnuolo and Franz-Erich Wolter Integrated Visualization and Analysis of a Multi-scale Biomedical Knowledge Space Proceedings of the EuroVis Workshop on Visual Analytics 25-29 The Eurographics Association 2014 Beschreibungstext anzeigen The study and analysis of relationships in a complex and multi-scale data set is a challenge of information and scientific visualization. This work proposes an integrated visualization to capture all the important aspects of multi-scale data into the same view by leveraging the multi-scale biomedical knowledge encoded into an underly- ing ontology. Ontology supports visualization by providing semantic means to identify relevant items that must be presented to the user. The study and analysis of relationships across the scales are presented as results of queries to the multi-scale biomedical knowledge space. We demonstrate the prototype of the graphical interface of an integrated visualization framework and the knowledge formalization support in an example scenario related to the musculoskeletal diseases. |
Jan Rzepecki, Ricardo Manuel Millan Vaquero, Alexander Vais, Karl-Ingo Friese, Franz-Erich Wolter Multimodal Approach for Natural Biomedical Multi-scale Exploration Lecture Notes in Computer Science 8888 620–631 Springer Switzerland 2014 Beschreibungstext anzeigen Pathologies which simultaneously involve different spatial scales are often difficult to understand. Biomedical data from different modalities and spatio-temporal scales needs to be combined to obtain an understandable representation for its examination. Despite of requests to improve the exploration of multi-scale biomedical data, no major progress has been made in terms of a common strategy combining the state of art in visualization and interaction. This work presents a multimodal approach for a natural biomedical multi-scale exploration. The synergy of a multi-layered visualization environment based on spatial scales with hand gestures and haptic interfaces opens new perspectives for a natural data manipulation. |
| Beiträge in Büchern |
| 2014 |
R. M. Millán Vaquero, J. Rzepecki, K.-I. Friese, F.-E. Wolter Visualization and User Interaction Methods for Multiscale Biomedical Data 5 N. Magnenat-Thalmann, O. Ratib, and H. F. Choi Springer London 2014 Beschreibungstext anzeigen The need for handling huge amounts of data from several sources is becoming increasingly important for biomedical scientists. In the past, there were mainly different modalities in imaging techniques that had to be combined. Those modalities usually measured different physical effects from the same object and shared dimensions and resolution. Nowadays, an increasing number of complex use cases exist in biomedical science and clinical diagnostics that require data from various domains, each one related to a different spatiotemporal scale. Multiscale spatial visualization and interaction can help physicians and scientists to explore and understand this data. In the recent years, the number of published articles on efficient scientist-centric visualization and interaction methods has drastically increased. This chapter describes current techniques on multiscale visualization and user interaction and proposes strategies to accommodate current needs in biomedical data analysis. |


